America’s agriculture system is more concentrated than ever. Waves of mergers and acquisitions across food and agriculture have funneled power into the hands of a few dominant corporations. Their unchecked integration has hollowed out competition, giving them outsized control over how Americans farm, work, and eat.
This level of concentration means these corporations now reach into every link of the food supply chain—from inputs and equipment to processing, marketing, financing, and insurance. And when one link in these massive, integrated chains breaks, the fallout spreads fast, putting our food security and national security at risk. Meanwhile, decades of price fixing and collusion have left farmers with shrinking paychecks and consumers facing sticky prices—quick to rise, slow to fall.
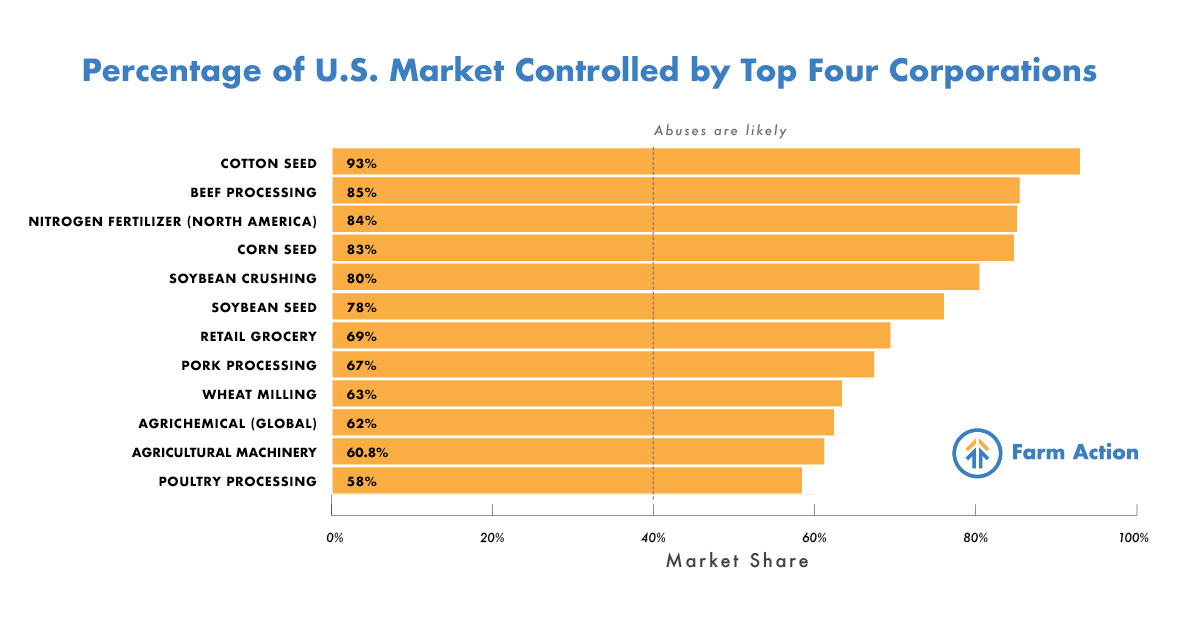
One simple way to measure market concentration is the “top four” ratio, or CR4: the combined market share of the four largest firms. Economists generally warn that market abuses become more likely when CR4 exceeds 40%. Below, we list concentration ratios, dominant firms, and their market shares to show just how widespread concentration has become across U.S. agriculture. Our data reflect U.S. market shares unless otherwise noted.
Global Seed CR4: 51%
Global Agrichemical CR4: 62.3%
U.S. Soybean Seed CR4: 78.1%
U.S. Corn Seed CR4: 83.4%
U.S. Cotton Seed CR4: 93.6%
U.S. Agrichemical CR10: 85-90%
U.S. Seed Genetics for Corn, Soybeans, and Cotton CR2: 90%
Nitrogen Dominant Firms: CF Industries, Nutrien, Koch Industries, and Yara
Nitrogen Fertilizer CR4 (North America): 84%
Phosphate Dominant Firms: Mosaic and Nutrien
Phosphate Fertilizer CR2 (North America): 86%
Potash Dominant Firms: Nutrien and Mosaic
Potash Fertilizer CR2 (North America): 89%
Fertilizer Distribution and Retail CR7: 71%
Deere & Co. is the most dominant agricultural equipment firm in the U.S.
All Agricultural Machinery in U.S. CR4: 60.8%
Large Tractors in U.S. CR3: 95%
Combines in U.S. CR3: 97%
The Herfindahl-Hirschman Index (HHI) is another measure of concentration. It is calculated by squaring the market share of each firm competing in a market and then summing the resulting numbers. It can range from 0-10,000, with lower values indicating more competitive markets. A market with an HHI of 2,500 or greater is considered highly concentrated.
Four entrenched dominants of global trade in agricultural commodities are known as the “ABCDs”: Archer Daniels Midland (ADM), Bunge, Cargill, and Louis Dreyfus.
U.S. Port Elevators CR4: 60%
Domestic Grain Storage Capacity CR7: 41%
U.S. River Elevators CR4: 45%+*
Subterminal Rail Elevators U.S. CR4: 22%+
U.S. Export Trade
End-user Industries:
Beef CR4: 80-85%
Pork CR4: 70%
Dairy
Poultry CR4: 58%
Poultry CR6: 70.2%
Egg CR5: 36-40%
Processed Food and Drinks CR4s:
Driscoll’s is dominant in berries.
Fresh-Cut Salad CR4: 54%
Carrots CR2: 60%
Retail Grocery CR4: 69%
Broadline Distribution CR10: 60-70%
Farm Credit System
Commercial Banking CR4: 41%
Please subscribe before reading and downloading.